Getting Started
Installation
Start by installing the peer dependencies of victory-native – React Native Reanimated, Gesture Handler, and Skia:
yarn add react-native-reanimated react-native-gesture-handler @shopify/react-native-skia
For Reanimated, you'll need to add "react-native-reanimated/plugin" to your plugins list in your babel.config.js config file.
Then install victory-native:
yarn add victory-native
Now you should be ready to go.
Your first chart
Let's create a basic line chart on a Cartesian grid. Let's mock out a little bit of mock data for "high temperature" for each day in a month:
const DATA = Array.from({ length: 31 }, (_, i) => ({
  day: i,
  highTmp: 40 + 30 * Math.random(),
}));
Instantiate a chart
Now, we'll use the CartesianChart component and pass in our data, specifying which property we'll be using for our x (independent variable) and y (dependent variable) keys.
import { View } from "react-native";
import { CartesianChart } from "victory-native";

// ...

function MyChart() {
  return (
    <View style={{ height: 300 }}>
      // 👇 start our chart
      <CartesianChart data={DATA} xKey="day" yKeys={["highTmp"]} />
    </View>
  );
}
At this point, we're you'll just see a blank view, since we aren't rendering anything useful to our charting canvas.
Add a line to the chart
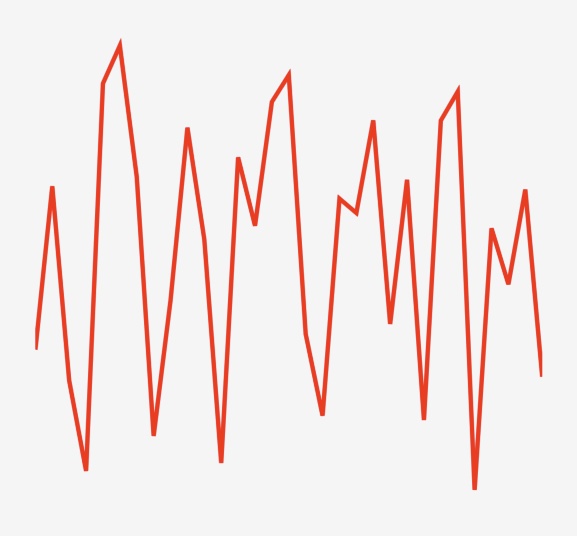
The CartesianChart uses a render function for its children prop. To render content inside of the Cartesian chart, you return Skia elements from the children render function. We'll use the Line component from victory-native to render a line path using our temperature data.
import { View } from "react-native";
import { CartesianChart, Line } from "victory-native";

function MyChart() {
  return (
    <View style={{ height: 300 }}>
      <CartesianChart data={DATA} xKey="day" yKeys={["highTmp"]}>
        {/* 👇 render function exposes various data, such as points. */}
        {({ points }) => (
          // 👇 and we'll use the Line component to render a line path.
          <Line points={points.highTmp} color="red" strokeWidth={3} />
        )}
      </CartesianChart>
    </View>
  );
}
Now we've got a line path to represent our daily high temperature data!
Add some axes
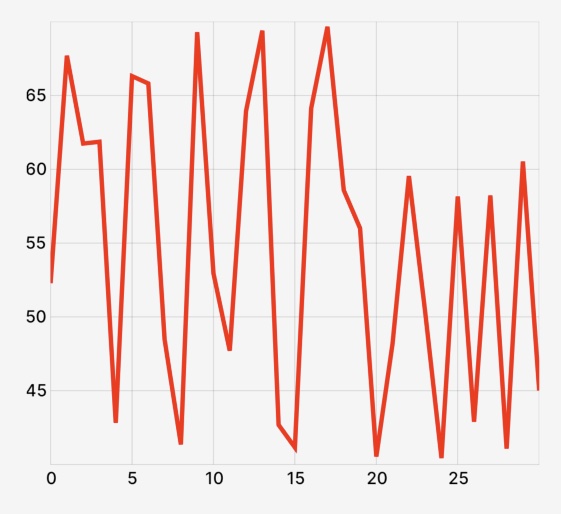
You might want some axes to make your line graph a bit easier to read and interpret. The CartesianChart offers out-of-the-box support for axes and grids to make it easy to get up and running with some axes. Let's add some now.
import { View } from "react-native";
import { CartesianChart, Line } from "victory-native";
// 👇 import a font file you'd like to use for tick labels
import inter from "../assets/inter-medium.ttf";

function MyChart() {
  const font = useFont(inter, 12);

  return (
    <View style={{ height: 300 }}>
      <CartesianChart
        data={DATA}
        xKey="day"
        yKeys={["highTmp"]}
        // 👇 pass the font, opting in to axes.
        axisOptions={{ font }}
      >
        {({ points }) => (
          <Line points={points.highTmp} color="red" strokeWidth={3} />
        )}
      </CartesianChart>
    </View>
  );
}
And now we've got some axes and grid lines!
Adding a tooltip
You might also want to give your users a way to interact with the line chart you've created. Handling user gestures can be complex, especially in canvas-like drawing context. Victory Native helps streamline this for you. To build a basic tooltip, we'll do three things.
- Create a
ChartPressStateinstance using theuseChartPressStatehook fromvictory-native. - Pass our state variable into our
<CartesianChart />element. - Use the Reanimated shared values from the
ChartPressStateinstance in a customToolTipcomponent that we'll create to create our tooltip element.
We'll start by creating our ChartPressState instance and pass it to our chart element.
// ...
import { /*...*/ useChartPressState } from "victory-native";

function MyChart() {
  // ...
  // 👇 create our chart press state
  const { state, isActive } = useChartPressState({ x: 0, y: { highTmp: 0 } });

  return (
    // ...
    <CartesianChart
      // ...
      chartPressState={state} // 👈 and pass it to our chart.
    >
      {/* ... */}
    </CartesianChart>
    // ...
  );
}

// ...
Then we'll create a ToolTip component that uses some Reanimated SharedValues from our state variable.
import type { SharedValue } from "react-native-reanimated";
// ...

function ToolTip({ x, y }: { x: SharedValue<number>; y: SharedValue<number> }) {
  return <Circle cx={x} cy={y} r={8} color="black" />;
}
And we'll conditionally show an instance of this component when the chart press is active:
// ...
import { /*...*/ useChartPressState } from "victory-native";

function MyChart() {
  // ...
  const { state, isActive } = useChartPressState({ x: 0, y: { highTmp: 0 } });

  return (
    // ...
    <CartesianChart
      // ...
      chartPressState={state}
    >
      {
        (/*...*/) => (
          <>
            {/* 👇 Conditionally show our tooltip and pass values. */}
            {isActive ? (
              <ToolTip x={state.x.position} y={state.y.highTmp.position} />
            ) : null}
          </>
        )
      }
    </CartesianChart>
    // ...
  );
}

// ...
With this in place, we have a rather simple tooltip UI:
Putting this all together, we have something like the following:
import * as React from "react";
import { View } from "react-native";
import { CartesianChart, Line, useChartPressState } from "victory-native";
import { Circle, useFont } from "@shopify/react-native-skia";
import type { SharedValue } from "react-native-reanimated";
import inter from "../../assets/inter-medium.ttf"; // Wherever your font actually lives

function MyChart() {
  const font = useFont(inter, 12);
  const { state, isActive } = useChartPressState({ x: 0, y: { highTmp: 0 } });

  return (
    <View style={{ height: 300 }}>
      <CartesianChart
        data={DATA}
        xKey="day"
        yKeys={["highTmp"]}
        axisOptions={{
          font,
        }}
        chartPressState={state}
      >
        {({ points }) => (
          <>
            <Line points={points.highTmp} color="red" strokeWidth={3} />
            {isActive && (
              <ToolTip x={state.x.position} y={state.y.highTmp.position} />
            )}
          </>
        )}
      </CartesianChart>
    </View>
  );
}

function ToolTip({ x, y }: { x: SharedValue<number>; y: SharedValue<number> }) {
  return <Circle cx={x} cy={y} r={8} color="black" />;
}

const DATA = Array.from({ length: 31 }, (_, i) => ({
  day: i,
  highTmp: 40 + 30 * Math.random(),
}));